Graphics Examples

Graphics Examples

See the following examples of how you can use IDL visualizations.
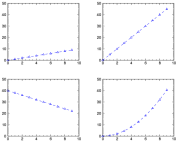
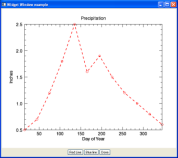
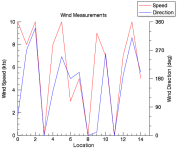
Plot Examples

line plot 2D plot polar plot
2D plot 3D plot error plot
bar plot stacked bar plot
 

Map Examples

map projections map image with projection
map with contour map continents map continents

Image Examples

image transparency regular-grid data save image as KML
binary data using RGB colors save contour as KML

Image Analysis

image types image filters resize
shift (align)

scale and rotate

detect edges

smooth fast fourier transform (FFT) sharpen

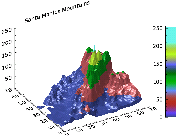
Surface, Contour, and Vector Examples

surface surface with contour filled contours
map with contour image with contour surface with contour
elevation on map image wind vectors streamlines

Annotations Examples

map with labels plot with labels math and greek symbols
add axes text, ellipse, polygon, polyline window, polygon and ellipses
move axes, add a colorbar add a legend animate (move, translate)
symbols on a map

Changing and Adding Properties

change plot line properties Change graphic properties move axes
add axes to a 3D graphic add axes colorbar

Graphics Window Examples

multiple plots using LAYOUT multiple graphics using POSITION
plot with subplot in same window  

Graphics Resources