Open topic with navigation
What's New
What's New in IDL 8.2
IDL 8.2 adds complex functionality to IDL Graphics, provides a new look and new features to Widget programming, and simplified building of custom tools for ENVI. Other improvements include streamlined project builds and new fonts for Unicode math symbols.
Note: If you are new to IDL or upgrading from an older version, see also: What's New in IDL 8.0 and What's New in IDL 8.1
Graphics
Thick Line Drawing
IDL 8.2 now draws higher-quality thick lines. This change affects lines with a thickness greater than one pixel, drawing clean joins at corners and intersections. This technology also draws curved and spiral lines smoothly and with enhanced detail. The following examples illustrate the improvements:
|

|

|
Lines join cleanly at the corners. Angles that join at less than 45 degrees are beveled, and those greater than 45 degrees are pointed.
|
|

|

|
Line thickness is consistent and the center displays at a higher resolution.
|
|

|

|
Line thickness is consistent and the center is round. Line ends are always perpendicular to the line.
|
Note: The new line-drawing functionality may result in slower performance for thick lines. See the LINE_QUALITY property of the graphics objects classes IDLgrBuffer, IDLgrClipboard, IDLgrPDF, IDLgrPrinter, and IDLgrWindow.
Array Arguments to the ARROW Function
Previously, with the ARROW function, you could draw only one arrow at a time. Now, the ARROW function accepts arrays for the start and end points, and also for the COLOR, FILL_COLOR, HEAD_SIZE and THICK properties. This allows you to create an unlimited number of arrows with a single call. For examples see the ARROW function.
Custom Ranges for the AXIS Function
A new COORD_TRANSFORM property for the AXIS function lets you define a linear transform between the graphic's data units and the axis units. For example, if you have a plot in degrees Celsius, you can add an axis in degrees Fahrenheit, with appropriate tick marks and tick labels. The AXIS_RANGE property lets you restrict the axis range to only a portion of the full dataspace range. The DATA property lets you pin an axis to a data position, so that panning or zooming the data will cause the axis to move with the data. See Axes for an example.
In addition to custom ranges, you can now rotate the tick mark labels on axes with the [XYZ]TEXT_ORIENTATION property.
Array Arguments to the SYMBOL Function
Previously, with the SYMBOL function, you could draw only one symbol at a time. Now, the SYMBOL function accepts arrays for the symbol locations, and also for the LABEL_STRING, SYM_COLOR, and SYM_TEXT properties. This allows you to create an unlimited number of symbols with a single call. For examples see the SYMBOL function.

New BACKGROUND_COLOR and BACKGROUND_TRANSPARENCY Properties
New BACKGROUND_COLOR and BACKGROUND_TRANSPARENCY properties have been added to the graphics functions. For example, setting the BACKGROUND_COLOR property on the PLOT function will change the background of the region containing the plot. Setting the background color of a 3D graphic (such as a SURFACE) will add in "walls" of that color that sit behind the graphic. Setting the background color on the WINDOW will change the background of the entire window. For graphics, the BACKGROUND_TRANSPARENCY can be used to change the opacity of the background color. For example:
p = PLOT3D(/TEST, BACKGROUND_COLOR='lemon chiffon', $
AXIS_STYLE=2, DEPTH_CUE=[0,1])
p.window.BACKGROUND_COLOR = 'lavender'
New Erase method for Graphics Windows
A new ::Erase method has been added to the graphics window object. The Erase method clears out the contents of the window, but does not close the window. This allows you to create new graphics within an existing window, and without the overhead of recreating the window. An optional COLOR keyword lets you change the background color after the erase. For details see the WINDOW function.
New CLIP Property for all Graphics Functions
A new CLIP property has been added to all graphics functions. The default is CLIP=1, which causes the graphics object to be clipped when it extends outside of the dataspace range. If you set CLIP=0 then no clipping will occur. This property is ignored for objects that are in the annotation layer instead of in the dataspace.
New DejaVuSans TrueType Font
A new TrueType font has been added to the IDL distribution. The DejaVuSans font contains numerous Unicode mathematical symbols, which are available either through their Unicode numbers or as TeX commands via the TEXT function:
This font is now available for Direct Graphics, Object Graphics, and the Graphics functions. The Embedded Formatting Commands have been changed so that !10 now selects this font instead of the Symbol font. For examples of the new characters see SHOWFONT and the TEXT function.
New LABEL_FORMAT, LATITUDES, and LONGITUDES Properties for MAPGRID Function
A new LABEL_FORMAT property has been added to the MAPGRID function. The label format can be set to an IDL function name, and allows you to create custom labels for the longitude and latitude grid lines on a map.
The LATITUDES and LONGITUDES properties allow you to retrieve the MAPGRIDLINE child objects from the MAPGRID object. You can then control all of the display properties for each individual grid line.
For details see the MAPGRID function.
New COLORBAR Properties for Discrete and Custom Colorbars
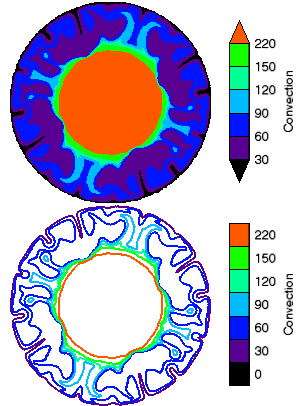
The COLORBAR function now supports discrete colorbars for use with the CONTOUR function. When you create a Colorbar from a Contour plot, the colorbar will automatically have discrete color boxes, one for each contour level. In addition, the COLORBAR function has the following new properties: RANGE, RGB_TABLE, TAPER, and TEXT_ORIENTATION. Together with the existing TICKNAME property, you can define your own custom colorbars (either continuous or discrete).
As an example of discrete colorbars with contour plots:
file = FILEPATH('convec.dat', $
SUBDIR=['examples', 'data'])
z = READ_BINARY(file,DATA_DIMS=[248,248])
index = [0,30,60,90,120,150,220]
c1 = CONTOUR(z, /FILL, ASPECT_RATIO=1, DIM=[300,500], $
RGB_TABLE=39, RGB_INDICES=index, C_VALUE=index, $
LAYOUT=[1,2,1], AXIS_STYLE=0, MARGIN=0)
; Create a discrete colorbar with vertical orientation.
; The ends are automatically tapered for a filled contour.
cb = COLORBAR(TARGET=c1, TITLE='Convection', /BORDER, $
ORIENTATION=1, TEXTPOS=1, POSITION=[0.8,0.55,0.85,0.95])
c2 = CONTOUR(z, C_THICK=2, ASPECT_RATIO=1, /CURRENT, $
RGB_TABLE=39, RGB_INDICES=index, C_VALUE=index, $
LAYOUT=[1,2,2], AXIS_STYLE=0, MARGIN=0)
; Create a discrete colorbar with vertical orientation.
; Labels are centered on the colors for a line contour.
cb = COLORBAR(TARGET=c2, TITLE='Convection', /BORDER, $
ORIENTATION=1, TEXTPOS=1, POSITION=[0.8,0.05,0.85,0.45])
Legend now supports Vector Plots
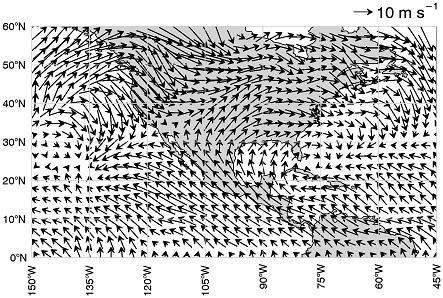
The LEGEND function now allows you to add a legend to a VECTOR plot. In addition, you can now retrieve the individual legend items and set properties on those objects, including the legend label, the sample vector magnitude (for vector plots), the sample line length (for line plots), and the text color. For example:
; Set up the map projection, grid, and continents.
m = Map('Equirectangular', LIMIT=[0,-150,60,-45], $
LABEL_POSITION=0, COLOR='light gray', LABEL_COLOR='black')
m1 = MapContinents(FILL_COLOR='light gray')
; Read the wind data, create a vector plot
RESTORE, FILEPATH('globalwinds.dat', SUBDIR=['examples','data'])
v = Vector(u, v, x, y, /OVERPLOT, LENGTH_SCALE=2)
; Add the legend
l = Legend(SAMPLE_MAGNITUDE=10, UNITS='$m s^{-1}$', $
POSITION=m.MapForward(-45,61), /DATA, $
VERTICAL_ALIGNMENT='bottom')
For details see the LEGEND function.
How to Use IDL Graphics
The IDL 8.2 Help system provides a new section on Image Analysis, as well as new examples of how to use filtering and other features that were traditionally used in Direct and Object Graphics.
Service Pack 1 Updates
Antialiasing
By default, antialiasing is now used when drawing all lines, polygons, shapes, contours, and surface lines in Graphics. The ANTIALIAS property can be used to turn off the default behavior.
A new ANTIALIAS property has also been added to IDLgrPolygon and IDLgrSurface. The default value for IDLgrPolygon and IDLgrSurface objects is 0.
Colorbar and Legend
You can now insert a colorbar and a legend from the toolbar in a Graphics window.
Color Tables
- Custom color tables can now be created using the COLORTABLE function.
- Additional color tables based on ColorBrewer schemes are available.
Graphics Event Handler
You can now easily override the default event-handling behavior on graphics windows. The new EVENT_HANDLER property lets you pass in an object reference to an IDL class that can implement the following methods: ::MouseDown, ::MouseUp, ::MouseMotion, ::MouseWheel, ::KeyHandler, and ::SelectChange. When one of these events is received by the graphics window, the appropriate method is called on your object first. Your object can then perform any necessary actions, and then return either 1 to continue processing the event, or 0 to swallow the event. The EVENT_HANDLER property is available on both the WINDOW object and the WIDGET_WINDOW function. See Creating a Graphics Event Handler Class for details on how to write this object class.
PLOT HISTOGRAM property
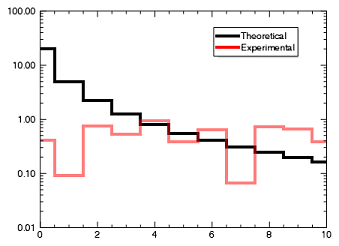
With the HISTOGRAM property, the PLOT function can now display data in a histogram style, with horizontal and vertical lines connecting each point. For example:
a = findgen(11)
b = 20./(a+1)^2
p1 = PLOT(a, b, '4', /HISTOGRAM, NAME='Theoretical', $
/YLOG, YRANGE=[0.01,100])
p2 = PLOT(RANDOMU(-1, 11), '4r', NAME='Experimental', $
TRANSPARENCY=50, /HISTOGRAM, /OVERPLOT)
h = LEGEND(POSITION=[9,50], /DATA)
See PLOT for more information.
Multiple Plot Layout
When displaying multiple plots in a window, IDL now automatically calculates margins. You can specify just the order of the plots using the LAYOUT keyword, rather than specifying exact locations using POSITION, as shown below:
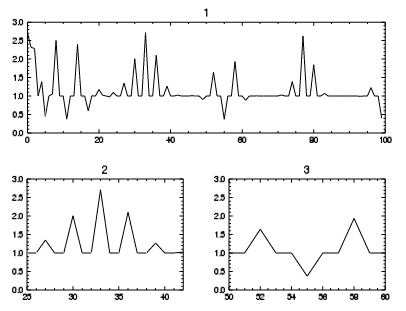
fn = exp(SIN(FINDGEN(100))^FINDGEN(100))
w1 = WINDOW()
p1 = PLOT(fn, LAYOUT = [1, 2, 1], /CURRENT, TITLE = '1')
p2 = PLOT(fn, LAYOUT = [2, 2, 3], xrange=[25, 42], /CURRENT, TITLE = '2')
p3 = PLOT(fn, LAYOUT = [2, 2, 4], xrange=[50, 60], /CURRENT, TITLE = '3')
The next example displays several plots in a 3x3 matrix in a single window:
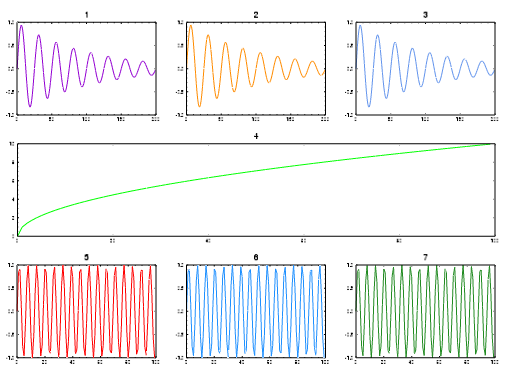
w2 = WINDOW(DIMENSIONS=[1200,900])
p = PLOT(/test, LAYOUT=[3, 3, 1], /CURRENT, COLOR='Dark Violet', TITLE = '1')
p = PLOT(/test, LAYOUT=[3, 3, 2], /CURRENT, COLOR='Dark Orange', TITLE = '2')
p = PLOT(/test, LAYOUT=[3, 3, 3], /CURRENT, COLOR='Cornflower', TITLE = '3')
p = PLOT(SQRT(FINDGEN(100)), LAYOUT = [1, 3, 2], COLOR='Lime', /CURRENT, TITLE = '4')
p = PLOT(SIN(FINDGEN(100)), LAYOUT = [3, 3, 7], COLOR='Red', /CURRENT, TITLE = '5')
p = PLOT(SIN(FINDGEN(100)), LAYOUT = [3, 3, 8], COLOR='Dodger Blue', /CURRENT, TITLE = '6')
p = PLOT(SIN(FINDGEN(100)), LAYOUT = [3, 3, 9], COLOR='Forest Green', /CURRENT, TITLE = '7')
Miscellaneous Graphics Changes
- Tick Format - The AXIS_STYLE "exponent" value is now available to show exponential notation in plots.
- Abbreviated Keywords - IDL Graphics keywords can be abbreviated.
- POLYGON - Added the RGB_TABLE and VERT_COLORS properties to POLYGON
- NCDF_CREATE - Added of the NETCDF3_64BIT keyword to NCDF_CREATE
Widgets
Updated Buttons
Widgets on Microsoft Windows platforms have a more modern appearance, using rounded edges for bitmap buttons.
Alpha Channel
Widgets can now use 32-bit (RGBA) images for bitmap buttons. See WIDGET_BUTTON and WIDGET_TREE for complete information.
WIDGET_TREE Checkboxes
Checkboxes have been added to tree widgets in this release. The checkbox functionality is accessed via the "checkbox" family of keywords. The tree widget must have checkboxes enabled in order for the nodes to have checkboxes. This can be set only at creation and cannot be controlled later. However, the state of each node can be set at any time, either programmatically or by the user clicking on a checkbox. Leaf nodes can have values of 0 (unchecked) or 1 (checked). Folder nodes can have values of 0 (unchecked), 1 (checked) or 2 (mixed). The "mixed" state is intended for folder nodes that have at least one but not all child nodes either checked or mixed. See WIDGET_TREE for more information.
SENSITIVE Keyword Change
The SENSITIVE keyword to WIDGET_TREE now allows you to set the sensitivity of an entire tree or just individual nodes.
WIDGET_CONTROL REDRAW Keyword
On Windows, the REDRAW keyword allows you to disable or enable widget updates for a widget and its children. This keyword differs from the UPDATE keyword, because REDRAW affects only the widget and its children. In addition, whenever REDRAW is set to 1, the specified widget and its children are immediately redrawn. On Unix, using this keyword is equivalent to using the UPDATE keyword. See WIDGET_CONTROL for more information.
SENSITIVE Keyword Change
The SENSITIVE keyword to WIDGET_CONTROL now dynamically updates node sensitivity.
Service Pack 1 Updates
- Combobox - New LIST_EVENTS keyword allows events to be generated when using the arrow keys to navigate combobox items.
- Table Cell Events - On Windows platforms, the ALL_EVENTS keyword now works as it does in UNIX platforms, returning cell events with keyboard arrow navigation.
- Tree Scrolling - Tree widgets can be scrolled using a mouse scroll wheel on UNIX as well as on Windows platforms.
Workbench
Duplicate Routine Names
The IDL Workbench now automatically checks for duplicate routine names and displays a warning icon at the relevant code line, and in the Problems View. There is also a preference setting that allows you to control this behavior.
Updates to the IDL Build Properties page
The Project build properties have been streamlined. The difference between Default and Custom builds has been removed, and several of the options have been simplified. For details, see IDL Build Properties.
ENVI Extension Wizard
You can build custom ENVI tools using the IDL Workbench. Use the ENVI Extension Wizard to build tools that appear in the ENVI Toolbox.
Font Size Keyboard Shortcuts
In the IDL Workbench, you can now use <Ctrl>+ and <Ctrl>– to increase or decrease the font size in the Editor and the IDL Console.
Support for Drop-in Plugins
The IDL Workbench now provides support for the Eclipse dropins folder. The dropins folder is located within the system-specific bin directory of your IDL installation. New plugins can be dropped into this folder to provide additional functionality for the IDL Workbench. For details see the README file within the dropins folder.
Service Pack 1 Updates
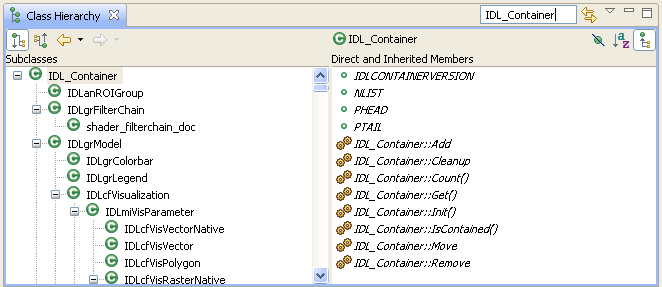
Class Hierarchy Browser
The Class Hierarchy browser is a view that displays the structure of the object hierarchy. To expose this feature, select Window > Class Hierarchy.
Macros
Macros is a menu option now available in the IDL Workbench. Macros allow you to assign IDL code to icons and keyboard shortcuts. You can use macros for tasks that you repeat often or want to simplify. When you add custom macros, you can define:
- The IDL code that the macro runs
- The macro name and menu label
- An icon to display on the macro toolbar
- A custom tooltip to display on the toolbar icon
- A keyboard shortcut to run the macro
Miscellaneous
PDF Documentation
The documentation that is provided in PDF is now listed in the Help Contents under Additional Topics.
New NULL keyword to ISA
The ISA function now has a NULL keyword, that returns 1 (TRUE) if the input variable is equal to !NULL, and 0 (FALSE) otherwise. This keyword allows you to distinguish between undefined variables and !NULL variables.
New NULL functionality for IDL_Container
The IDL_Container::Get method now has a NULL keyword. If this keyword is set, and no objects will be returned, then !NULL is returned instead of -1. In addition, the IDL_Container::Remove method has been enhanced so that it now quietly returns if !NULL is passed in. With these changes, you can now remove all objects of a certain type from the container without having to do any error checking. For example:
obj->Remove, obj->Get(/ALL, ISA='MyClass', /NULL)
Support for BigTIFF Files
IDL now supports reading and writing TIFF files larger than 4 GB on all platforms, including 32-bit systems. There are no API changes--if you create a TIFF file larger than 4 GB, IDL automatically creates a file with the correct BigTIFF header.
New Help for Video
For detailed information on how to use IDLffVideoWrite, see the new help section Creating Video.
Support for JSON (JavaScript Object Notation)
The new JSON_PARSE and JSON_SERIALIZE functions allow you to convert files or IDL variables into JSON strings, and vice versa. JSON (JavaScript Object Notation) is a lightweight data-interchange format, that is designed to be easy for humans to read and write, and for machines to parse and generate. Details on the JSON format can be found at http://www.json.org.
New List::Where and Hash::Where methods
The List::FindValue and Hash::FindValue methods have been renamed to List::Where and Hash::Where, for better consistency with the rest of IDL. The FindValue methods will still work, but are no longer documented and should not be used in new code.
Service Pack 1 Updates
Proleptic Gregorian Calendar
The JUL2GREG and GREG2JUL routines let you convert from Julian dates to the proleptic Gregorian calendar and vice versa. The proleptic Gregorian calendar is produced by extending the Gregorian calendar backwards to dates preceding its introduction in 1582. In the proleptic Gregorian calendar, there are no missing days in October 1582, every 4 years is a leap year, except if the year ends in a "00" then it is not a leap year, unless it is also divisible by 400 (in which case it is a leap year).
The proleptic Gregorian calendar is usually required for information exchange between international partners, as defined by ISO 8601:2004 (clause 3.2.1). The proleptic Gregorian calendar is not used by astronomers, who instead use the Julian Day Number, as given by the JULDAY function.
IDL 8.0 Functionality
If you are new to IDL or upgrading from an older version, see also: What's New in IDL 8.0 and What's New in IDL 8.1.