THE AGN DUSTY TORUS

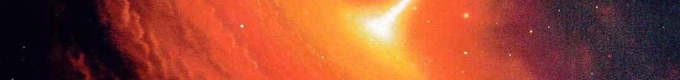
The infrared spectral energy distribution of Active Galactic Nuclei is attributed to the thermal emission from a thick layer of dust surrounding an accretion disk which, in turn, is accreting onto a supermassive black hole. The very intense and hard radiation emitted by the disk, due to the internal friction of the gas, is then absorbed by this dust which is heated to the highest possible temperatures (around 1000-1500 K) and is then re-emitted as thermal radiation in the 2-40 micron domain.
Many models have been developed during the years with the aim of trying to reproduce the mid-infrared spectrum of AGNs. The common feature to all the models is that you must at some point solve (or simulate) the radiative transfer equation.
INFRARED EMISSION FROM AGNs:
SMOOTH & 2-PHASE MODELS
I have developed myself such a model, and in this paper (J. Fritz; A. Franceschini; E. Hatziminaoglou; 2006. MNRAS, 366, 767) you can find all the details.
The models are available for download, in the form of 3 g-zipped tarfiles, each of them containing models with different parameters at a fixed covering angle.
✓ Θ = 140O
✓ Θ = 100O
✓ Θ = 60O
What you will find is just the Spectral Energy Distributions (SEDs), that you can easily use for data fitting, for example. Feel free to download and use them. They are an update version of the original Fritz et al. 2006 paper, expanded to better cover a larger and more physical parameter space, as explained in Feltre et al. (2012). If you need to know more or if you want to point out any problem just drop me an email.
Recently, I have been asked to provide a grid of models calculated assuming a slightly different SED for the accretion disk. In a study of a sample of type-1 AGN (Hatziminaoglou, Fritz et al., 2008), we faced this already known issue: the accretion disk SED in the optical is indeed well described by a power-law, but its index varies. Here you have some examples from the aforementioned paper:
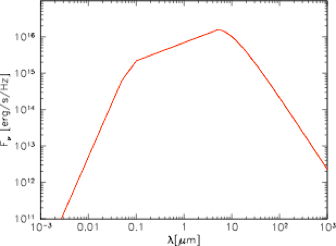
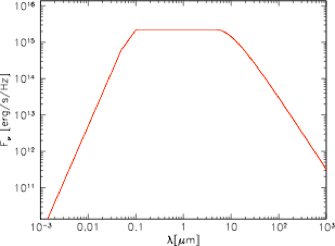
Type-1 torus models emission calculated assuming a "standard" (left) and "flat" (right) power-law SED for the main heating source. Both figures are from Hatziminaoglou, Fritz et al. (2008).
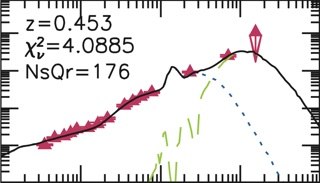
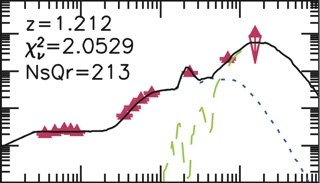
(Fluxes are in Jy). The complete SED for for these two different assumptions are the following:
Panchromatic SEDs for the accretion disk emission, considered to be the main heating source of the dust in the torus. The slopes of the power laws for the "standard" (right panel figure) case are taken as in Schartmann et al. (2005).
I have calculated a partially complete grid (it will be soon updated to match the one used in the Feltre et al. 2012 work), and you can download it here. The full grid is available upon request.
Models with the same parameters but being powered by these two different accretion SEDs, will result in negligible differences as far as the mid/far-infrared emission is concerned.

AGN SED MODELING: A STEP FURTHER
A smooth, continuous distribution of dust around an accretion disk is believed to be a simplification of the real physical situation. This is why lately a number of other approaches, mainly involving a clumpy distribution of dust, have been followed. Using SKIRT, a 3-D radiative transfer code developed by Maarten Baes in Ghent, we have gone a step further by adopting a dust density distribution which includes both a clumpy and a smooth component.
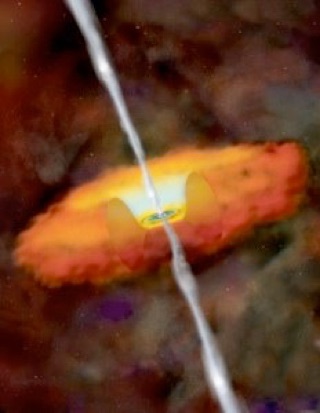
This work, led by Marko Stalevski (Belgrade Observatory), led to the creation of yet another set of models (both SEDs and images at various wavelengths) which you can freely download from the SKIRTor website. Just remember to drop a line to Marko to notify him you are using his model. In the picture above you can see a slice through the dust density distribution along the equatorial plane of the torus (what we would call a “type-1” view). The higher density clumps are “immersed“ in a much lower density, smooth dusty medium, which is denser towards the inner regions. As you can see, clumps are not single, independent entities, but they can intersect each other, giving rise to higher densities clumps in their overlapping regions. On the left you can see the cut, in the dust density distribution, on a “type-2” view. Both the smooth and the clumpy components are denser towards the innermost regions. In these two particular models the density is also decreasing as a function of the height above the equatorial plane.
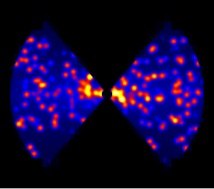
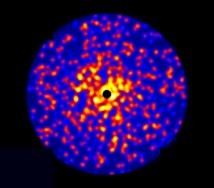
Top panel: a cut in the dust density map of torus as seen "edge-on" (Type-2 view).
Bottom panel: same as above, but the cut is made through the equatorial plane, for the case of a Type-1 view.
A COUPLE OF WORDS ON SED FITTING
I was invited to give a review talk on modeling and data fitting at the Royal Astronomical Society Specialist Discussion which was held in London in October, 2014: "Understanding Galaxies from their Spectral Energy Distribution: Models to Observations". I have tried to review various of the IR AGN emission models existing in the literature, together with the most common fitting codes.
Talking about data fitting, be careful, in general, about what you claim. As Enrico Fermi (quoting John Van Neumann) used to say:
“With four parameters I can fit an elephant, and with five I can make him wiggle his trunk”.
This turns particularly true in the case of broad-band SED fitting for AGNs, and I will show it to you.
Here’s an elephant:
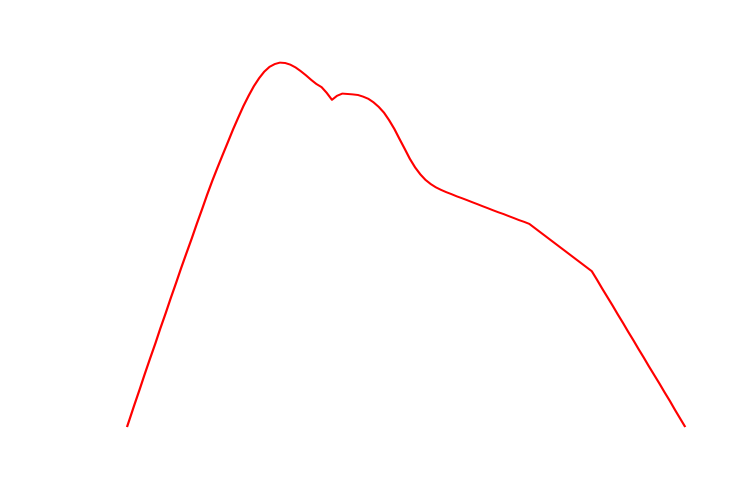
And what you see below is a fit using one of my smoothly-distributed dust models (red line):

Ok, the model needs to be in units of flux density, but you get the point!
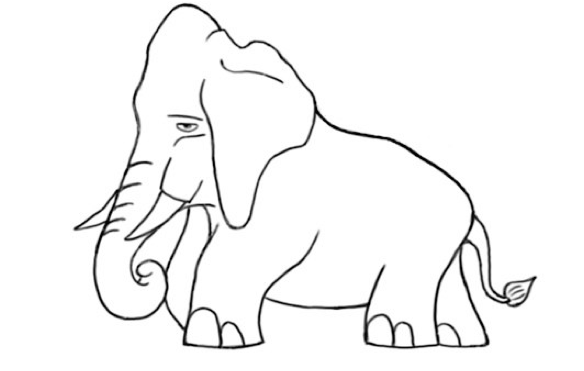
Elephant is courtesy of Joery Schroyen
The model will be further improved, and more news are about to come, so stay tuned!
