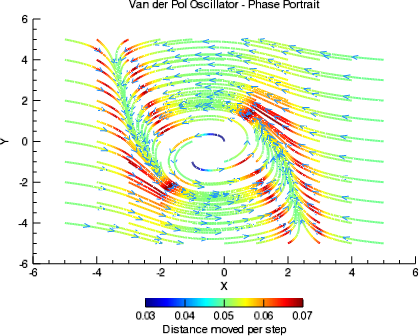
The STREAMLINE function draws a streamline plot.
The following lines create the graphic shown at the top of this topic.
n = 101
x = 10*DINDGEN(n)/(n-1) - 5
y = 10*DINDGEN(n)/(n-1) - 5
xx = REBIN(x, n, n)
yy = REBIN(TRANSPOSE(y), n, n)
mu = 1
xdot = mu*(xx - xx^3/3 - yy)
ydot = xx/mu
s = STREAMLINE(xdot, ydot, x, y, $
ARROW_COLOR="Dodger blue", $
ARROW_OFFSET=[0.25,0.5,0.75,1], $
STREAMLINE_STEPSIZE=0.05, $
POSITION=[0.1,0.22,0.95,0.9], $
X_STREAMPARTICLES=11, Y_STREAMPARTICLES=11, $
XTITLE='X', YTITLE='Y', $
TITLE='Van der Pol Oscillator - Phase Portrait')
; Change some properties.
s.THICK = 2
s.AUTO_COLOR = 1
s.AUTO_RANGE = [0.03,0.07]
s.RGB_TABLE = 33
; Add a colorbar.
c = COLORBAR(TARGET=s, MINOR=0, $
POSITION=[0.35,0.1,0.7,0.125], $
TITLE='Distance moved per step')
See Graphics Examples for additional examples using the STREAMLINE function.
graphic = STREAMLINE(U, V, [, X, Y ] [, Keywords=value] [, Properties=variable])
Keywords are applied only during the initial creation of the graphic.
[, AXIS_STYLE={0|1|2|3}] [, /BUFFER] [, /CURRENT] [, /DEVICE] [, DIMENSIONS=array [, LAYOUT=array] [, LOCATION=array] [, MARGIN=array] [, /NODATA] [, OVERPLOT=1 or variable] [, POSITION=array] [, WINDOW_TITLE=string]
Properties can be set as keywords to the function during creation, or retrieved or changed using the "." notation after creation.
ANTIALIAS, ARROW_COLOR, ARROW_OFFSET, ARROW_SIZE, ARROW_THICK, ARROW_TRANSPARENCY, ASPECT_RATIO, AUTO_COLOR, AUTO_RANGE, AXES, BACKGROUND_COLOR, BACKGROUND_TRANSPARENCY, CLIP, COLOR, CROSSHAIR, DIRECTION_CONVENTION, FONT_COLOR, FONT_NAME, FONT_SIZE, FONT_STYLE, GRID_UNITS, HIDE, NAME, RGB_TABLE, STREAMLINE_NSTEPS, STREAMLINE_STEPSIZE, THICK, TITLE, TRANSPARENCY, UVALUE, WINDOW, X_STREAMPARTICLES, Y_STREAMPARTICLES, XRANGE, YRANGE, ZVALUE
The STREAMLINE function returns a reference to the created graphic. Use the returned reference to manipulate the graphic after creation by changing properties or calling methods.
A one or two-dimensional array containing the horizontal components of the vector data. If the X and Y arguments are provided, the streamline starting locations are plotted as a function of the (x, y) locations. Otherwise, the streamline starting locations are plotted as a function of the array index of each element of U.
A one or two-dimensional array containing the vertical components of the vector data. V must have the same dimensions as U.
A one-dimensional array specifying the x-coordinates for the vector data. If U is a two-dimensional array then X must have the same number of elements as the first dimension of U, where each element of X specifies the x-coordinate for a column of U. If U is a one-dimensional array then X must have the same number of elements as U, where each element of X specifies the x-coordinate for the corresponding element of U.
A one-dimensional array specifying the y-coordinates for the vector data. If U is a two-dimensional array then Y must have the same number of elements as the second dimension of U, where each element of Y specifies the y-coordinate for a row of U. If U is a one-dimensional array then Y must have the same number of elements as U, where each element of Y specifies the y-coordinate for the corresponding element of U.
Keywords are applied only during the initial creation of the graphic.
Set this keyword to one of the following values:
You can set the following properties on the axes:
|
Property |
Description |
|---|---|
|
[XYZ]COLOR |
A string or RGB vector containing the axis color. |
|
[XYZ]GRIDSTYLE |
A string or integer giving the linestyle for tickmarks. |
|
[XYZ]LOG |
Set to 1 if the axis is logarithmic. |
|
[XYZ]MAJOR |
The number of major tick marks. Set to -1 to auto-compute, set to 0 to suppress. |
|
[XYZ]MINOR |
The number of minor tick marks. Set to -1 to auto-compute, set to 0 to suppress. |
|
[XYZ]SHOWTEXT |
Set to 1 to show text labels or 0 to hide the text labels. |
|
[XYZ]STYLE |
The axis range style. The valid values are: (0) "Nice" range. Default for all graphics except Image, Barplot, and Map. (1) Force the exact data range. Default for Image, Barplot, and Map. (2) Pad the axes slightly beyond the "nice" range. (3) Pad the axes slightly beyond the exact data range. Note: The [XYZ]RANGE takes precedence over this property. |
|
[XYZ]SUBTICKLEN |
The ratio of the minor tick length to the major tick length. The default is 0.5. |
|
[XYZ]TEXT_COLOR |
A string or RGB vector containing the axis text color. |
| [XYZ]TEXT_ORIENTATION | The angle (in degrees) of the tick mark labels. |
|
[XYZ]TEXTPOS |
Set to 1 to position text above the axis. The default is 0, below the axis. |
|
[XYZ]THICK |
Set to a floating-point value between 0 and 10 to specify the line thickness for tickmarks. A thickness of 0 gives a thin hairline. The default is 1. |
|
[XYZ]TICKDIR |
Set to 1 to draw the tickmarks facing outwards. The default is 0, facing inwards. |
|
[XYZ]TICKFONT_NAME |
A string containing the font name for the axis text. |
|
[XYZ]TICKFONT_SIZE |
The axis text size in points. |
|
[XYZ]TICKFONT_STYLE |
A string or integer containing the font style: "normal" (0), "bold" (1), "italic" (2), or "bold italic" (3). |
|
[XYZ]TICKFORMAT |
A string or string array of tick label formats. |
|
[XYZ]TICKINTERVAL |
The interval between major tick marks. |
|
[XYZ]TICKLAYOUT |
Set to 1 to suppress tick marks; set to 2 to draw a box around the tick labels. |
|
[XYZ]TICKLEN |
The normalized length of each major tick mark. Tick lengths < 0.25 are in arbitrary units that do not scale with the graphic. Larger tick lengths are normalized relative to the width of the graphic. The default is 0.05. |
|
[XYZ]TICKNAME |
A string array containing the tick labels. |
|
[XYZ]TICKUNITS |
A string giving the tick units. Valid values are "" (the default), "Years", "Months", "Days", "Hours", "Minutes", "Seconds", "Time", or "exponent" for exponential notation. If any of the time units are utilized, then the tick values are interpreted as Julian date/time values. If more than one unit is provided, the axis will be drawn with multiple levels. |
|
[XYZ]TICKVALUES |
An array of tick mark locations. |
|
[XYZ]TITLE |
A string giving the axis title. |
|
[XYZ]TRANSPARENCY |
An integer from 0-100 giving the percent transparency. |
For more detailed explanations of these properties, see the AXIS function.
Tip: You can also use the AXIS function to insert additional axes after the graphic has been created.
Set this keyword to 1 to direct the graphics to an off-screen buffer instead of creating a window.
Set this keyword to create the graphic in the current window. If no window exists, a new window is created. The WINDOW's SetCurrent method may be used to set the current window.
Set this keyword if values are specified in device coordinates (pixels) for the MARGIN and POSITION properties. (Normalized coordinates are the default for these properties.)
Set this keyword to a two-element vector of the form [width, height] to specify the window dimensions in pixels.
Set this keyword to a three-element vector [ncol, nrow, index] that arranges graphics in a grid. The first dimension ncol is the number of columns in the grid, nrow is the number of rows, and index is the grid position at which to place the graphic (starting at element 1). This keyword is ignored if either OVERPLOT or POSITION is specified.
Set this keyword to a two-element vector [X offset, Y offset] giving the window's screen offset in pixels.
Set this keyword to the current graphic’s margin values in the layout specified by the LAYOUT keyword. Use a scalar value to set the same margin on all sides, or use a four-element vector [left, bottom, right, top] to specify different margins on each side.
By default, margin values are expressed in normalized units ranging from 0.0 to 0.5. If the DEVICE keyword is set, the values are given in device units (pixels).
This keyword is ignored if either OVERSTREAMLINE or POSITION is specified.
Set this keyword to 1 to create the graphic, but without any data attached to it. The axes and title (if present) are also created and displayed. If the OVERPLOT keyword is specified, axis ranges will not change.
Note: You must still provide valid input arguments. The data range of the input arguments are used to automatically set the range of the axes. The [XYZ]RANGE properties may be used to override these default ranges.
Set this keyword to 1 (one) to place the graphic on top of the existing graphic in the current window. If no current window exists, a new window is created.
Set this keyword to an existing IDL Graphic reference to direct the new graphic to the window specified by the provided IDL Graphic reference.
Set this keyword to a four-element vector that determines the location of the visualization within the graphic window. The coordinates x0, y0 represent the lower left and x1, y1 represent the upper right corners of the data space. Coordinates are expressed in normalized units ranging from 0.0 to 1.0. If the DEVICE keyword is set, the units are given in device units (pixels).
Note: When using POSITION, factor in enough space to display the title and axis labels. For example, if you use POSITION to place your visualization at 0 on the X or Y axis, any labels for that axis will not be visible.
Set this keyword to the title of the IDL Graphic window. The title is displayed in the window's title bar.
Properties marked as (Init) are applied only during the initial creation of the graphic. All other properties can be set during creation, or retrieved or changed after creation.
By default anti-aliasing is used when drawing lines. Set this property to 0 to disable anti-aliasing.
Set this property to a string or RGB vector that specifies the color of the arrow heads on the streamlines. The default is the same color as the streamlines.
Set this property to a scalar or an array of floating-point values between 0.0 and 1.0, giving the locations of the arrow heads along each streamline. The default is 0.5, which draws an arrow head halfway along each streamline.
Set this property to a floating-point value giving the normalized size of the arrow heads. The default is 1.0.
Set this property to a value between 1.0 and 10.0, specifying the thickness of the arrow heads. The default is 1.0 points.
Set this property to an integer between 0 and 100 that specifies the percent transparency of the arrow heads. The default value is 0.
A floating point value indicating the ratio of the Y dimension to the X dimension in data units. If this property is set to a nonzero value, the aspect ratio will be preserved as the graphic is stretched or shrunk. The default value is 0 for all graphics except images, meaning that the aspect ratio is not fixed, but is allowed to change as the graphic is stretched or shrunk.
Set this property to enable or disable automatic coloring of streamlines. Possible values are:
Tip: The AUTO_RANGE property may be used to control the scaling from the data range into the 0-255 color table range.
Set this property to a two-element vector [min, max] giving the data scaling range for coloring by distance or direction. If AUTO_COLOR=1 or 2, then the distance or direction array is scaled from its original data range into the range 0-255. The AUTO_RANGE property may be used to control the minimum and maximum data values used in this scaling. The default value for AUTO_RANGE is the minimum and maximum values of the distance or direction array.
This property retrieves an array that contains all of the AXIS objects within the visualization. For example, for a plot visualization:
p = PLOT(/TEST)
ax = p.AXES
ax[0].TITLE = 'X axis'
ax[1].TITLE = 'Y axis'
ax[2].HIDE = 1 ; hide top X axis
ax[3].HIDE = 1 ; hide right Y axis
See AXIS for a list of the available properties.
Set this property to a string or RGB vector indicating the graphic's background color. The default value is [255, 255, 255] (white). Set this property to a scalar value to remove the background color.
Tip: To set the background color of the entire window, retrieve the window object using the WINDOW property, and set the BACKGROUND_COLOR on the window object.
Set this property to an integer between 0 and 100 giving the percent transparency of the background color. The default is 100 (completely transparent).
Note: If the BACKGROUND_COLOR property is changed, and the current background transparency is 100, then the BACKGROUND_TRANSPARENCY will be automatically set to 0 (opaque) so that you can see the new color.
Set this property to 1 to clip portions of the graphic that lie outside of the dataspace range, or to 0 to disable clipping. The default is 1.
Set this property to a string or RGB vector that specifies the streamline color. The default is "black".
Use this property to retrieve a reference to the Crosshair graphic. All graphics objects within the same set of axes share a single Crosshair graphic. For Plot graphics the default behavior is to display the crosshair when the plot is selected. For other graphics the crosshair is disabled. The STYLE property may be used to control the automatic crosshair display, while the LOCATION property is used to manually draw a crosshair.
You can get and set the following properties on the retrieved crosshair:
|
Property |
Description |
|---|---|
|
ANTIALIAS |
Set to 1 to enable anti-aliasing for the lines. |
|
COLOR |
A string or RGB vector containing the color. |
|
HIDE |
Set to 1 to hide the crosshair, 0 to show. |
|
INTERPOLATE |
Set to 1 to force interpolation between Plot data points when SNAP is active. For other graphics this property is ignored. The default is 0. |
|
LINESTYLE |
An integer or string giving the line style. The default is 'dot'. |
|
LOCATION |
The location at which to draw the crosshair. For Plot graphics, if SNAP is enabled, then only the X coordinate needs to be supplied. Otherwise, LOCATION should be set to a two-element vector [X, Y] for two-dimensional graphics or [X, Y, Z] for three-dimensional graphics. If STYLE is currently "None", then setting the LOCATION will automatically set the STYLE to "Manual". |
|
NAME |
The name of the graphic. |
|
SNAP |
Set to 1 to snap the crosshair to the nearest Plot data point. For other graphics this property is ignored. The default is 1. |
|
STYLE |
An integer or string giving the crosshair style. Possible values are: 0 - "None" - never draw the crosshair. This is the default. 1 - "Manual" - draw the crosshair using the LOCATION property. 2 - "Auto" - automatically draw the crosshair. This is the default for plots. |
|
THICK |
The thickness of the lines. The default is 1. |
|
TRANSPARENCY |
The percent transparency of the lines. The default is 50. |
|
UVALUE |
An IDL variable of any data type. |
For example, use the CROSSHAIR property to draw a crosshair on an image:
im = IMAGE(/TEST, TRANSPARENCY=50, AXIS_STYLE=2)
c = im.CROSSHAIR
c.COLOR = 'red'
c.THICK = 2
c.LOCATION = [300, 200]
See Creating Mouse Event Functions for a more detailed crosshair example.
Set this property to indicate the convention to be used when displaying streamline directions. Possible values are:
Note: This property does not change the visual appearance of the streamlines - only the direction that is reported in the window's status bar is affected.
Set this property to a string or RGB vector that specifies the text color for the title and axes (if present). The default value is "black".
Set this property equal to a string specifying the IDL or system font for the title and axes (if present). The default value is “Helvetica”.
Set this property equal to an integer specifying the font size for the title and axes (if present). The default value is 16 points.
Set this property equal to an integer or a string specifying the font style for the title and axes (if present). Allowed values are:
|
Integer |
String |
Resulting Style |
|
0 |
"Normal" or "rm" |
Default (roman) |
|
1 |
"Bold" or "bf" |
Bold |
|
2 |
"Italic" or "it" |
Italic |
|
3 |
"Bold italic" or "bi" |
Bold italic |
Set this property to a string or integer specifying the units for the streamline grid. This property applies only when a map projection is inserted. It has the following values:
0 or "" - None. The grid is in arbitrary units that are not tied to a map projection. The streamlines will not be warped to the current map projection.
1 or "m" or "meters" - Meters. The grid is in meters, and is tied to a particular map projection. The streamlines will be warped to the current map projection.
2 or "deg" or "degrees" - Degrees. The grid is in degrees longitude/latitude, and will be automatically warped to the current map projection.
Set this property to 1 to hide the graphic. Set HIDE to 0 to show the graphic.
A string that specifies the name of the graphic. The name can be used to retrieve the graphic using the brackets array notation. If NAME is not set then a default name is chosen based on the graphic type.
The number of the predefined IDL color table, or a 3 x 256 or 256 x 3 byte array containing color values to use for the color palette. This color palette is used when the AUTO_COLOR property is set. The default is to use a grayscale ramp.
Set this property to an integer giving the number of steps to take for each streamline. The default is 100.
Set this property to a floating point value giving the normalized step size for each step in a streamline. The default is 0.2.
Set this property to a value between 0 and 10 that specifies the thickness of the streamlines. A thickness of 0 displays a thin hairline on the chosen device. The default value is 1.
Set this property to a string specifying a title. The title properties may be modified using FONT_COLOR, FONT_NAME, FONT_SIZE, and FONT_STYLE. After creation the TITLE property may be used to retrieve a reference to the title text object, and the TEXT properties may be used to modify the title object.
You can also add Greek letters and mathematical symbols using a TeX-like syntax. These symbols need to be enclosed within a pair of "$" characters. See Adding Mathematical Symbols and Greek Letters to the Text String for details on the available symbols.
An integer between 0 and 100 that specifies the percent transparency of the graphic. The default value is 0.
Set this property to an IDL variable of any data type.
This property retrieves a reference to the WINDOW object which contains the graphic.
If STREAMLINES is set, then set this property to an integer giving the number of streamline particles in the x direction. The default is 25. This property is ignored for arrows or wind barbs.
If STREAMLINES is set, then set this property to an integer giving the number of streamline particles in the y direction. The default is 25. This property is ignored for arrows or wind barbs.
A two-element vector giving the X data range to streamline. The default behavior is to streamline the entire data range.
A two-element vector giving the Y data range to streamline. The default behavior is to streamline the entire data range.
A scalar value to be used as the z-coordinate for the entire streamline. By default, 0.0 is used as the z-coordinate.
| 8.0 | Introduced |
| 8.1 |
Added the following properties: CROSSHAIR, UVALUE, [XYZ]SHOWTEXT, [XYZ]STYLE The THICK property was changed to accept a value between 0 and 10. Added the following methods: Delete, GetData, GetValueAtLocation, MapForward, MapInverse, SetData |
| 8.2 | Added AXES, BACKGROUND_COLOR, BACKGROUND_TRANSPARENCY, CLIP properties. |
| 8.2.1 |
Added ANTIALIAS property. [XYZ]TICKUNITS accepts exponent as a value |